by Shomesh Chaudhuri | Jul 6, 2022
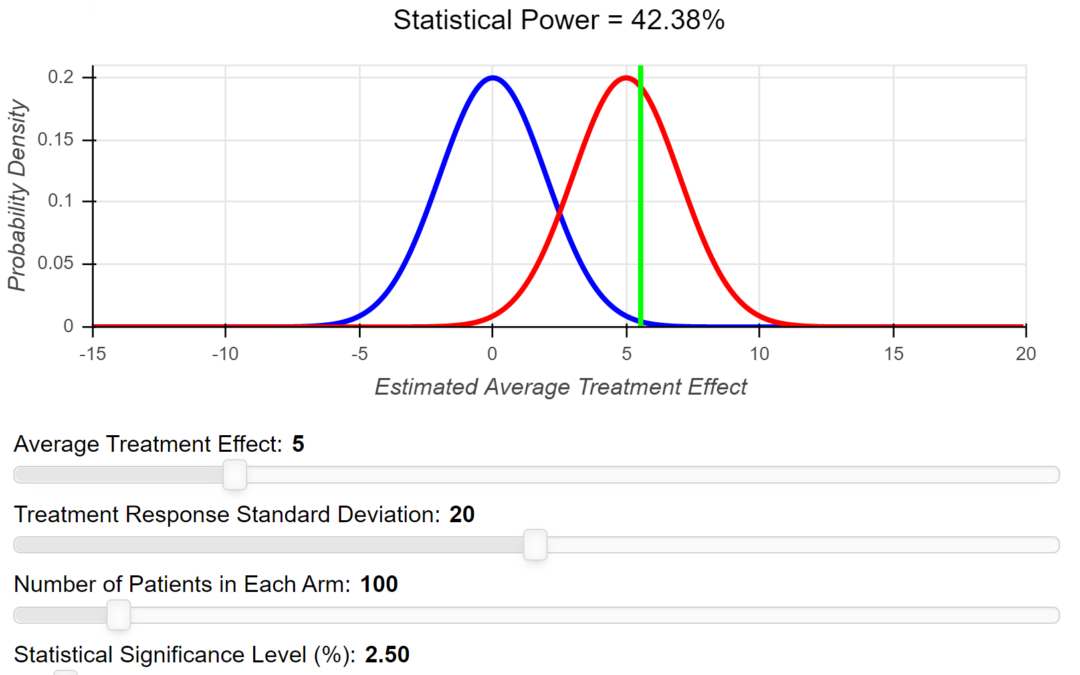
Randomized Clinical Trials The interactive online graph calculates the statistical power of a balanced two-arm RCT. What happens when the number of patients in the trial is increased? Notice the trade-off that exists between statistical power and the statistical...
by Shomesh Chaudhuri | Jul 6, 2022
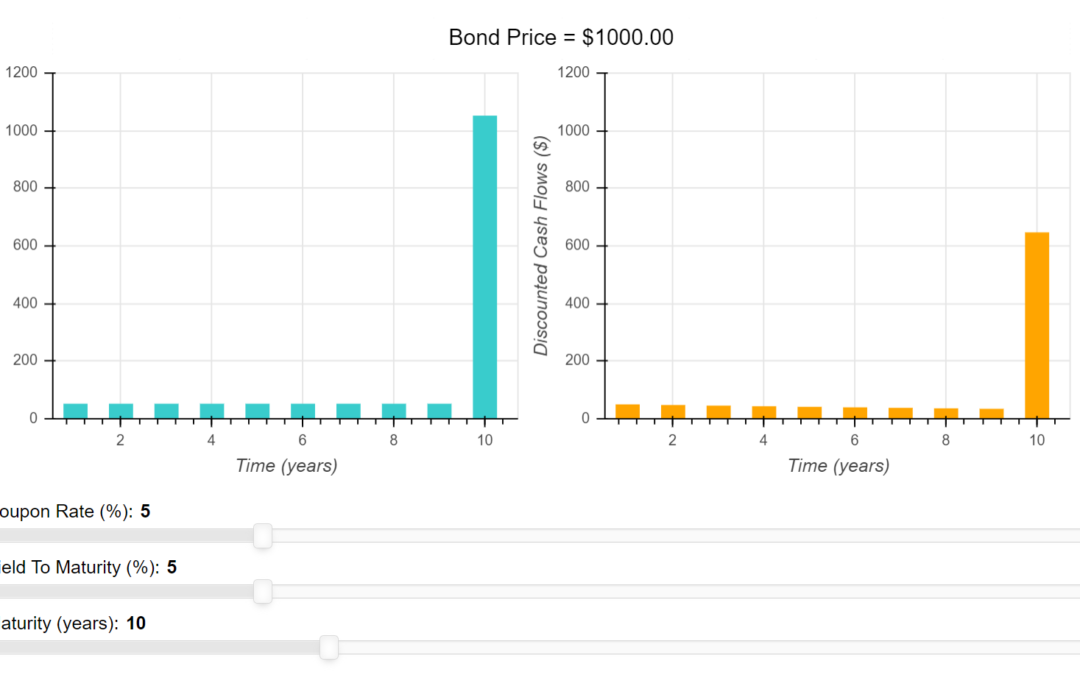
Coupon Bonds The interactive online graph calculates the price of a bond given its coupon rate, yield-to-maturity, and maturity. What happens to the price as you change these...
by Shomesh Chaudhuri | Jul 6, 2022
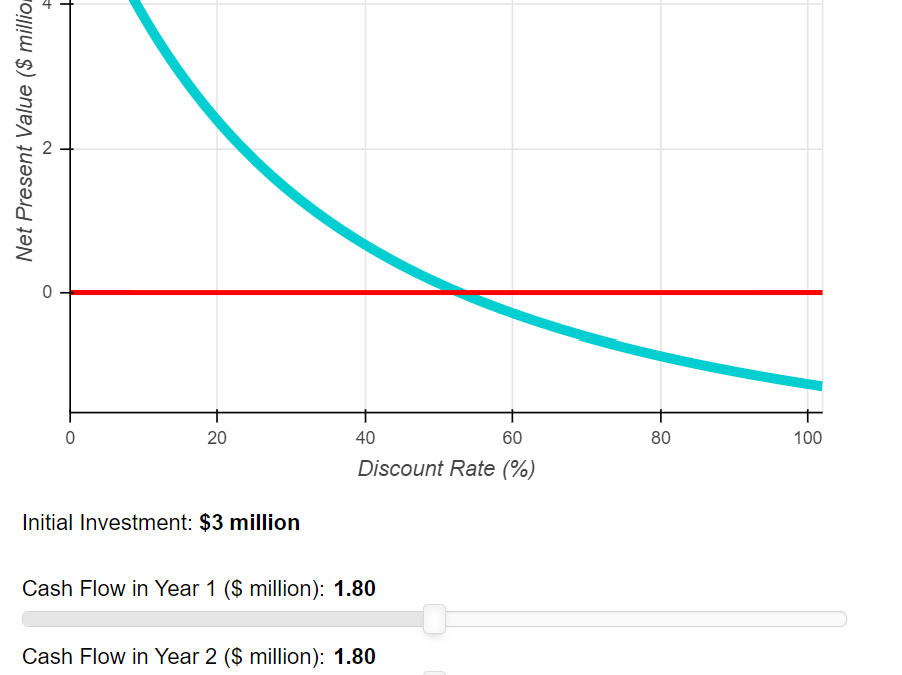
Internal Rate of Return The interactive online graph shows the IRR of a project with an initial investment of $3 million and 5 years of subsequent cash flows. What happens to the IRR (i.e., the discount rate that makes the NPV of the project equal to $0) as you change...
by Shomesh Chaudhuri | Jul 6, 2022
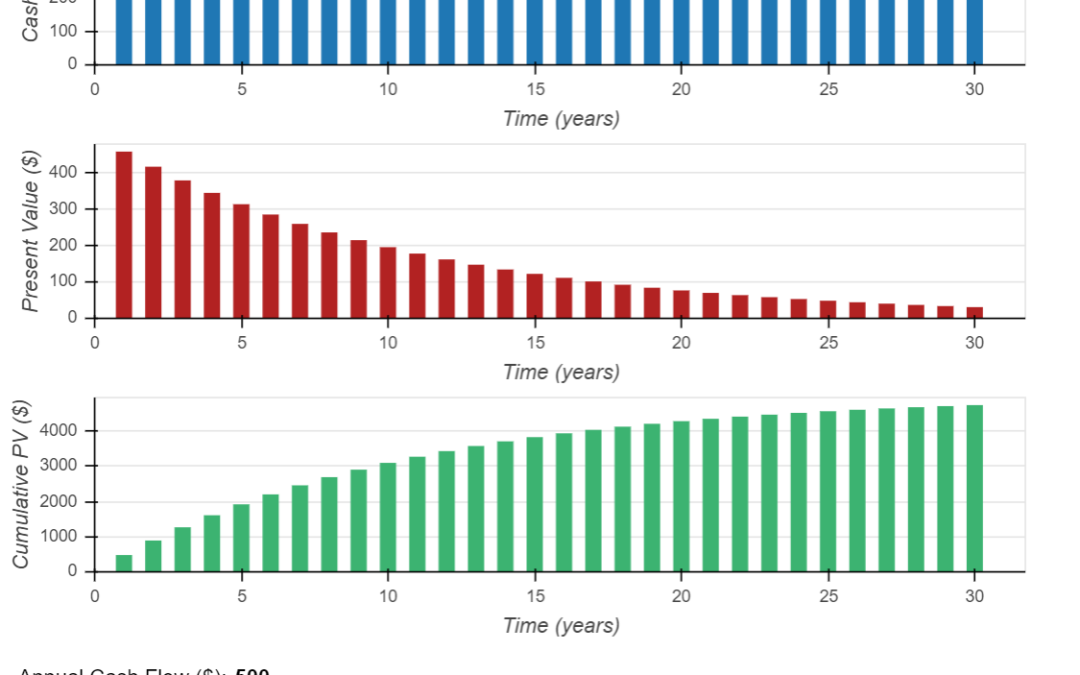
The Annuity Formula The interactive online graph shows the cash flows of an annuity over time. Whathappens to the present value of future cash flows as you change the discount rate and time...
by Shomesh Chaudhuri | Jul 6, 2022
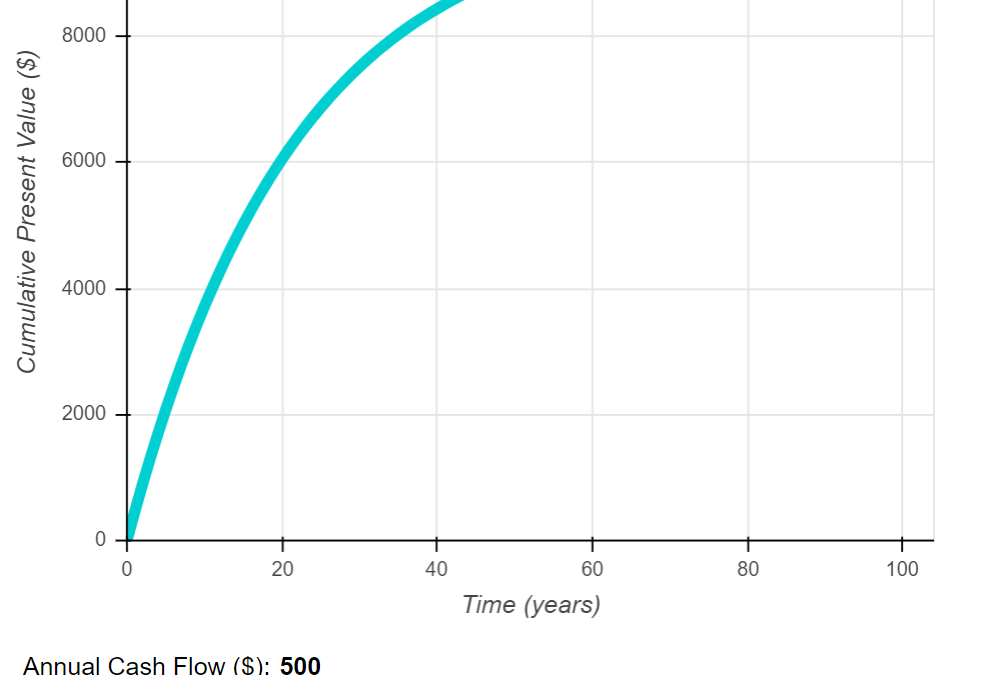
The Perpetuity Formula The interactive online graph shows the cumulative present value of a perpetuity over time. What happens to the shape of the curve when the growth rate becomes larger than the discount...