by Shomesh Chaudhuri | Jul 6, 2022
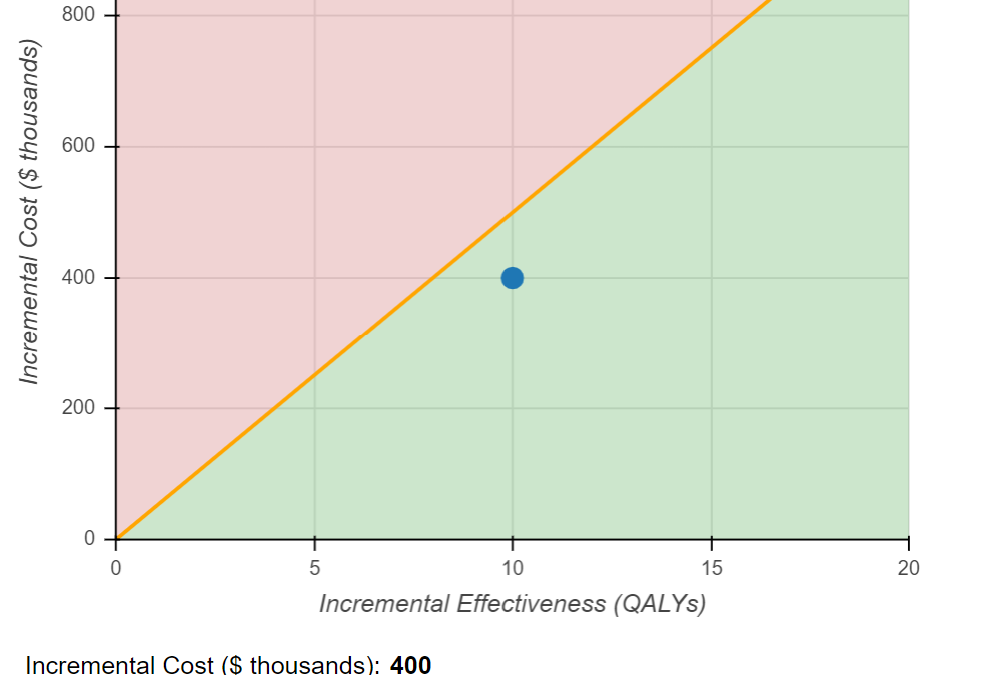
Incremental Cost-Effectiveness Ratio The interactive online graph shows the region (shaded green) for therapies deemed cost-effective given a particular cost-effectiveness threshold. What happens to the cost-effectiveness of a therapy if you decrease its incremental...
by Shomesh Chaudhuri | Jul 6, 2022
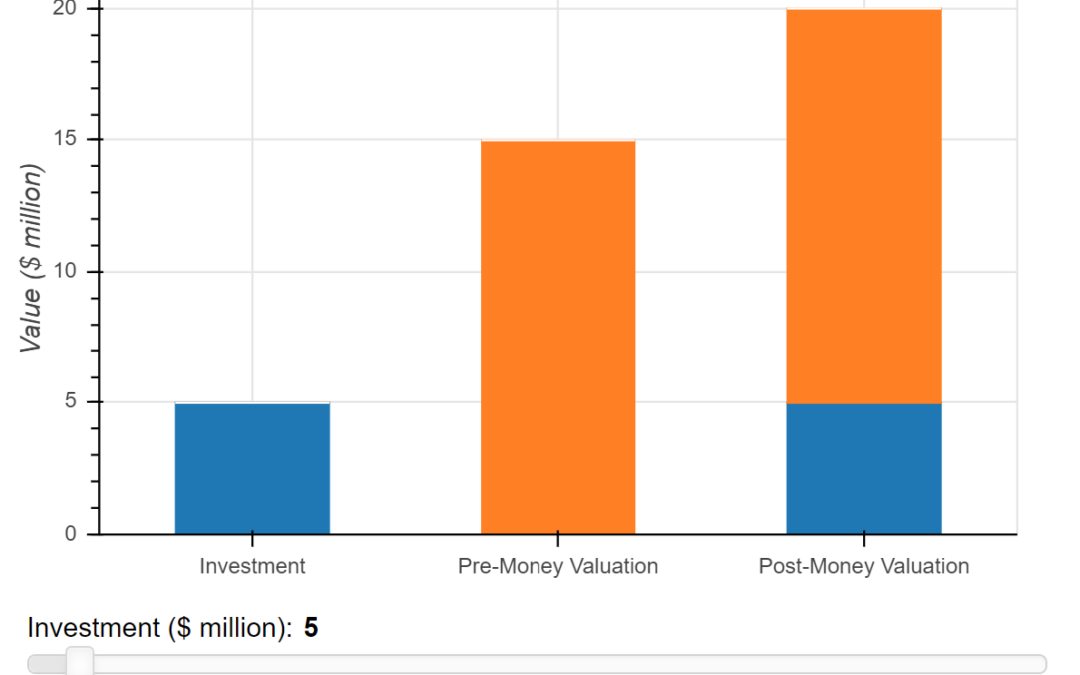
Pre- and Post-Money Valuation The interactive online graph calculates the pre- and post-money valuations of a start-up receiving external funding. What happens to the pre-money valuation as the equity the investor receives in exchange for a fixed investment...
by Shomesh Chaudhuri | Jul 6, 2022
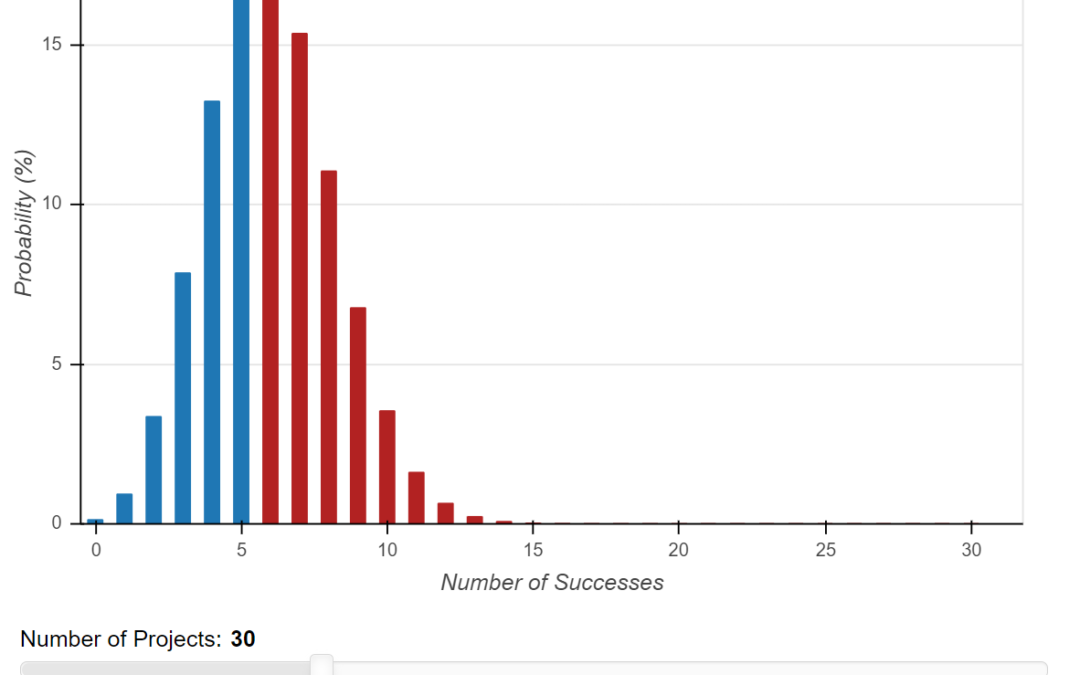
The Binomial Distribution The interactive online graph shows the distribution of the number of successes of a portfolio of projects given independent project outcomes. The scenarios with at least k successes are shown in red, and the total probability of having at...
by Shomesh Chaudhuri | Jul 6, 2022
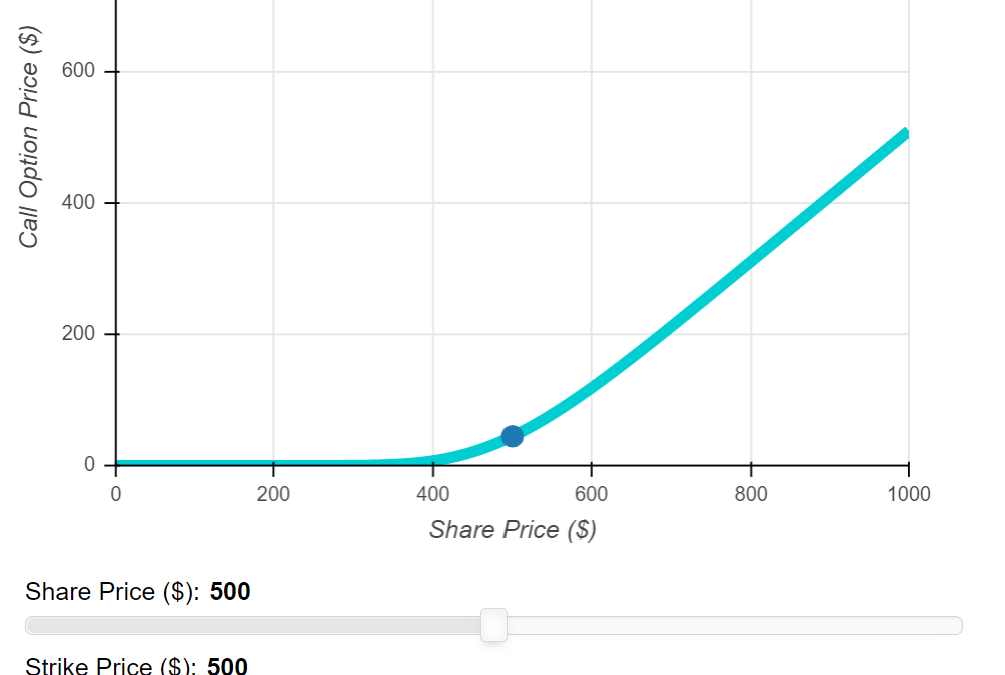
The Black-Scholes/Merton Formula The interactive online graph calculates the price of a call option using the Black–Scholes/Merton formula. What happens to the option’s price if you change the volatility of the underlying stock? What happens if you change the option’s...
by Shomesh Chaudhuri | Jul 6, 2022
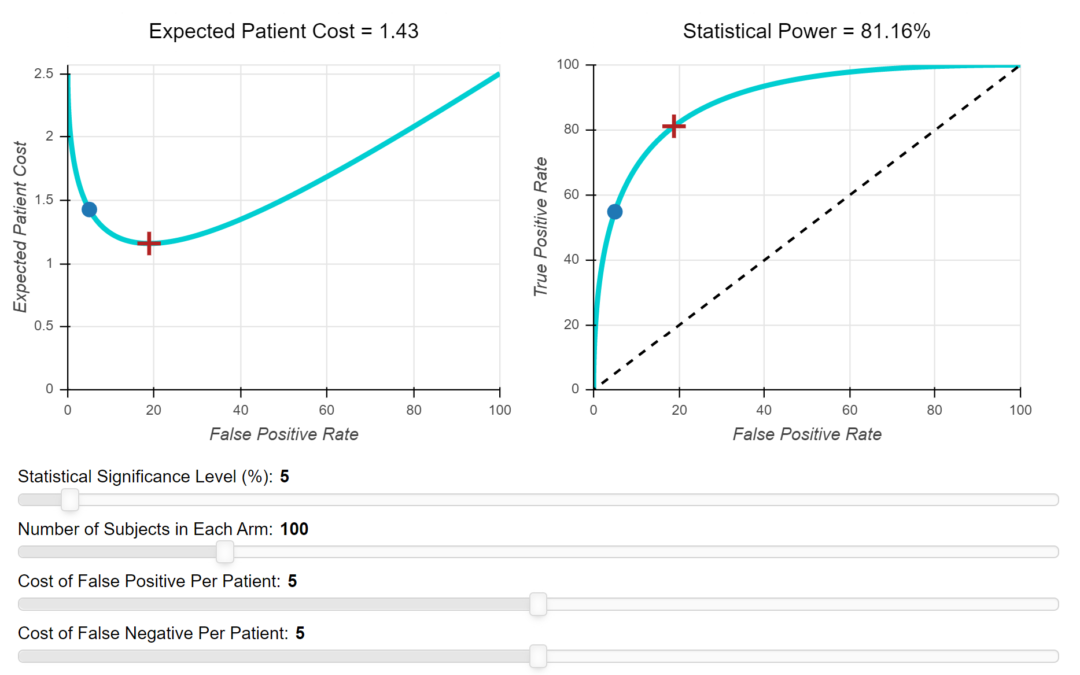
Bayesian Decision Analysis and Patient Preferences The interactive online graph shows the expected “cost” to patients for an RCT design with a particular statistical significance level. It also shows the trade-off between the false positive rate (i.e., Type 1 error)...